What does Brilliant View have to offer?
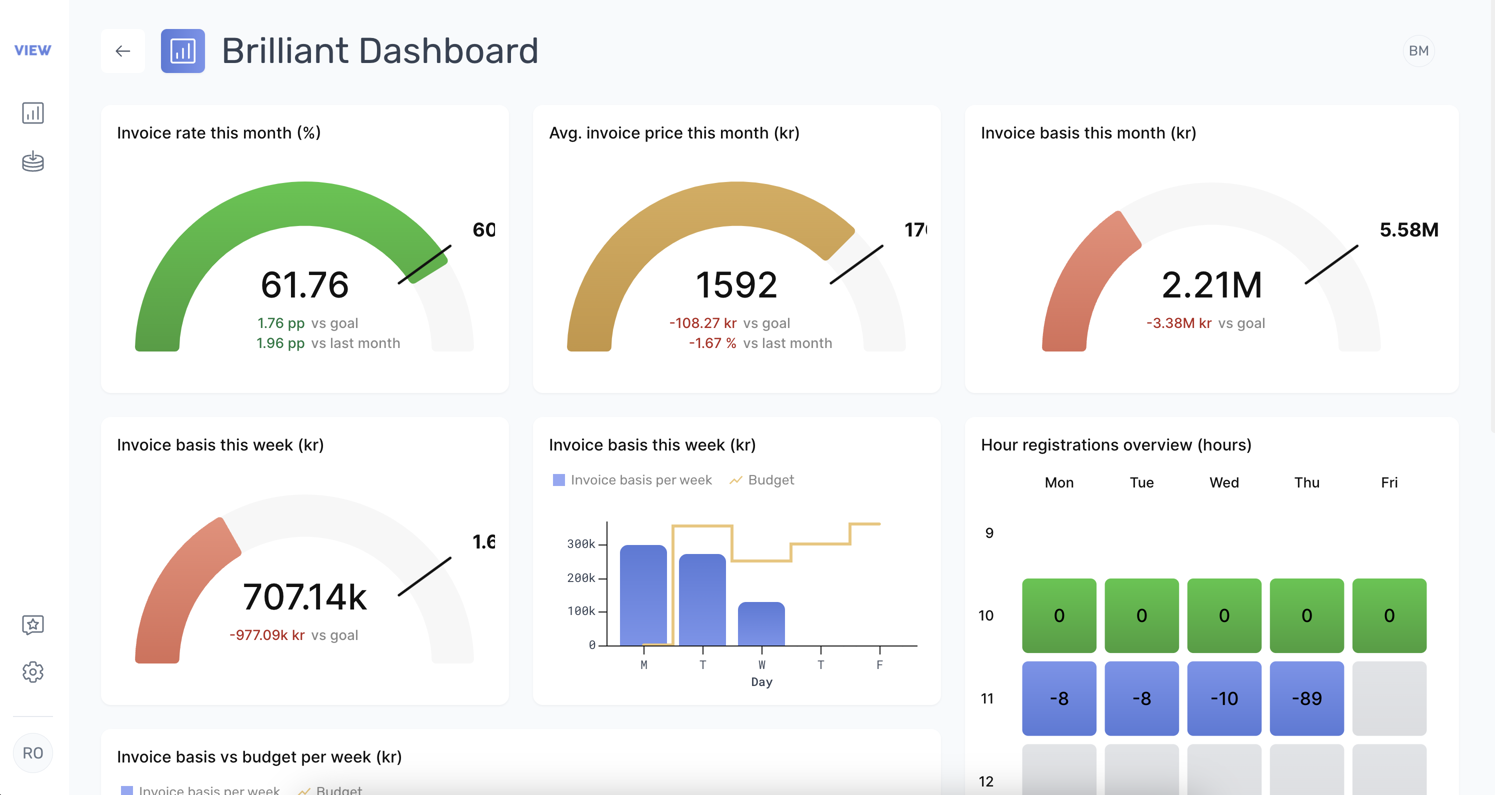
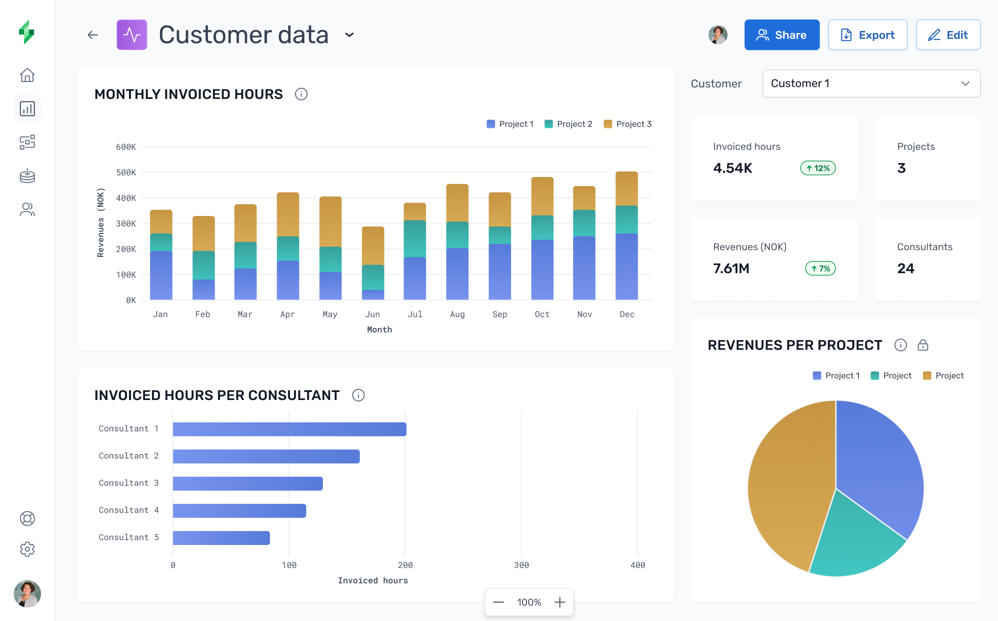
Brilliant View connects and displays your company data on the fly, allowing you to create and tailor dashboards with your most important KPIs.

Get started in 1-2-3!
Brilliant View is designed to get you up and running with your data quickly.

Step 1
Connect your data sources
Integrate your company's data from ERP systems and more using API keys.

Step 2
Build dashboards
Create intuitive dashboards with the help of the graph library and the AI assistant.

Step 3
Gain better control
Leverage insights from your data to achieve greater control and make smarter, data-driven decisions.
The insights you need
Brilliant View offers a range of powerful features, giving you and your team complete control over key metrics and KPIs—all in one place.
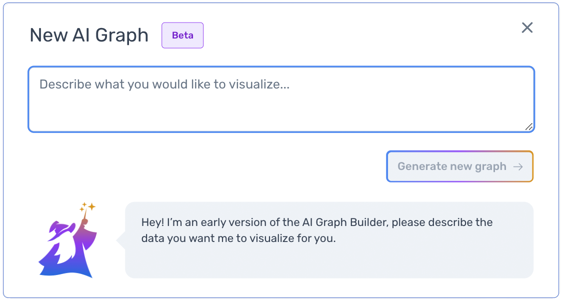
Build graphs using artificial intelligence!
With the AI assistant, you can create dashboards tailored to your reporting needs effortlessly.


Always up-to-date
With frequent updates throughout the day, you can trust that your numbers are always current.

Dashboards for everyone
All employees can create their own dashboards and access insights from shared ones.

Share insights with others
Whether it’s a shared screen in the office or regular reports for the board, you can build and share dashboards easily.

Drag & drop
Effortlessly drag and drop pre-made graphs into your dashboard, adjusting size and layout to fit your needs.

Connect in no time
Easily integrate and manage connected data sources with API functionality.

Filter your data
Use filters to quickly find the answers you're looking for in your data.

Continuous development
Brilliant is continually adding new features to Brilliant View and regularly updating the platform.

Support & assistance
With Brilliant View, support and assistance are always just a click away.
Upcoming features
Brilliant View is constantly evolving, and our customers automatically receive the newest updates and features as they are completed.
Driven by innovation
Brilliant View is revolutionizing the data capture and analysis market with artificial intelligence. We’re working on custom features for data analysis and AI in secure, closed environments, which will save customers from today’s manual tasks.
In upcoming updates, we will introduce a range of new features that will provide even better insights and control over your business, helping you make even smarter, data-driven decisions.


AI Connector
Connect any data source to Brilliant View using AI.

Chat with AI about your data
Ask the AI assistant for insights and correlations in your data!

Insights and alerts from AI
Get insights and alerts about changes in numbers and trends with the help of AI.

More graphs in the studio
An expanded selection of graphs and charts to build dashboards with.

Teams and permissions
Define different teams and manage access to dashboards for each team.

Custom alerts
Set reference points and parameters to trigger alerts for you and your team.

Updated UI
Trend indicators, status updates, summaries, and many other small visual improvements.

Data labels from integrations
Overview of the data and fields pulled from each integration and used in your graphs.

Custom branding
Dress Brilliant View in your company’s colors and logo, so your organization feels more ownership of the product.

Booking system
An integrated booking system for resources, customers, and projects, useful for forecasts and budgeting.

Budgeting tool
Plan monthly revenues and expenses for budgeting, forecasting, and cost allocation.

